TL;DR:
Karpenter simplifies Kubernetes cluster management by automatically provisioning the right nodes at the right time, helping optimise costs and performance. Unlike EKS Auto Mode, self-managed Karpenter offers full observability—logs, metrics, and dashboards—to monitor scaling decisions, detect bottlenecks, and fine-tune cluster behaviour. Setting up robust monitoring with tools like Prometheus, Grafana, or commercial platforms ensures reliable workloads and prevents unexpected outages.
Table of Contents
Introduction
One of the famous quotes from Dr Werner Vogels says
Everything fails, all the time.
The introduction of Karpenter, simplifies Kubernetes infrastructure with the right nodes at the right time. However, proactive monitoring of Karpenter helps teams optimise costs, identify scheduling bottlenecks, and ensure workload reliability.
In the previous Part 1 and Part 2 blogs of “Enhance Kubernetes cluster performance and optimise costs with Karpenter”, we discussed:
- What is Karpenter and its components?
- How it works and advantages over Cluster Auto Scaler.
- How to deploy Karpenter in a Kubernetes cluster?
- What is EKS Auto Mode?
- EKS with Karpenter vs EKS Auto Mode, and how to choose one over the other.
In this blog, let’s deep dive into the Observability side of things.
How to monitor Karpenter?
Though Karpenter is a mature and stable open-source project widely adopted for production workloads, it is critical to “scrape metrics from the Karpenter controller” into a monitoring solution (e.g., Prometheus & Grafana) to gain visibility into provisioning decisions, scaling performance, and potential inefficiencies.
Unlike EKS Auto Mode, where AWS manages scaling logic and hides these details, customer managed Karpenter offers transparency and allows for observability, to gather fine-grained insight into its scaling behaviour. Capturing metrics and set up monitoring is crucial for continuously finetuning.
Karpenter Architecture
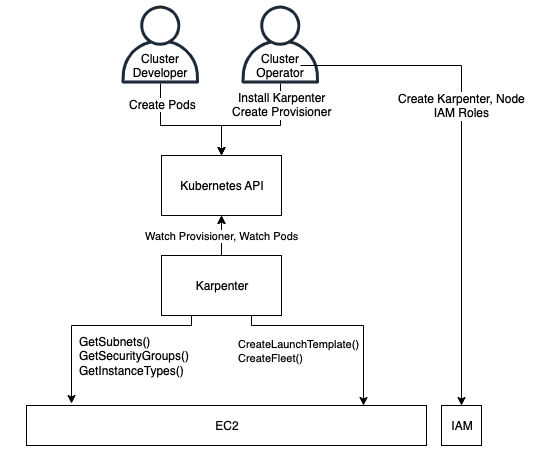
- Cluster Operator: Someone who installs and configures Karpenter in a Kubernetes cluster, and sets up Karpenter’s configuration and permissions.
- Cluster Developer: Developer or Consumer who can create pods, typically through Deployments, Stateful Sets, DaemonSets, or other pod-controller types.
- Karpenter Controller: The Karpenter application pod that operates inside a cluster.
When Karpenter is deployed in an EKS Cluster using Helm or EKS add-ons, it deploys various Kubernetes resources for it to work. Karpenter Controller Pods is one of the resources.
Note: Karpenter Controller Pods should not run in the infrastructure managed by Karpenter to avoid circular dependency.
Karpenter Controller Pods make decision around node provisioning and removing nodes from cluster, moving application pods between nodes on the cluster based on NodePool, NodeClass and Disruption Budgets. Karpenter controllers’ pods generates both logs and metrics that can be used for monitoring.
- Karpenter Controller Logs or Karpenter logs
- Karpenter Metrics
Karpenter Logs
Karpenter logs are generated by Karpenter Pods, which can be inspected directly or can be forwarded for forensic analysis. Logs can be forwarded to;
- Amazon CloudWatch Logs
- Custom options: – Forward using Fluent bit, Loki, Fluentd, etc.
- Forward to Datadog, Splunk, etc.
Below is an example of Karpenter controller logs you would typically see in an EKS cluster, covering provisioning, scheduling, and consolidation events. These logs are useful for understanding what Karpenter is doing at any given point in time. Unless they are forwarded and stored externally, these logs are not retained permanently by the EKS cluster and will be lost when the Karpenter pods restart.
Example Karpenter logs:
					{"level":"INFO","ts":"2026-01-19T01:12:03.421Z","logger":"controller","msg":"discovered nodepool","commit":"a1b2c3d","nodepool":"default"}

{"level":"INFO","ts":"2026-01-19T01:12:05.118Z","logger":"provisioner","msg":"found unschedulable pods","pods":3}

{"level":"INFO","ts":"2026-01-19T01:12:05.456Z","logger":"provisioner","msg":"computing instance types","nodepool":"default","requirements":{"cpu":"2","memory":"4Gi"}}

{"level":"INFO","ts":"2026-01-19T01:12:06.031Z","logger":"provisioner","msg":"launching node","instance-type":"m6i.large","zone":"ap-southeast-2a","capacity-type":"on-demand"}

{"level":"INFO","ts":"2026-01-19T01:12:36.882Z","logger":"controller","msg":"node registered","node":"ip-10-0-23-114.ap-southeast-2.compute.internal"}

{"level":"INFO","ts":"2026-01-19T01:12:38.214Z","logger":"controller","msg":"initialized node","node":"ip-10-0-23-114.ap-southeast-2.compute.internal"}

{"level":"INFO","ts":"2026-01-19T01:18:12.902Z","logger":"consolidation","msg":"candidate for consolidation","node":"ip-10-0-23-114.ap-southeast-2.compute.internal","reason":"underutilized"}

{"level":"INFO","ts":"2026-01-19T01:18:15.447Z","logger":"consolidation","msg":"terminating node","node":"ip-10-0-23-114.ap-southeast-2.compute.internal"}

{"level":"INFO","ts":"2026-01-19T01:18:42.019Z","logger":"controller","msg":"node deleted","node":"ip-10-0-23-114.ap-southeast-2.compute.internal"}

{"level":"WARN","ts":"2026-01-19T01:22:10.633Z","logger":"provisioner","msg":"unable to schedule pod","pod":"payments-api-7d9f6","reason":"no instance type satisfies requirements"}
Karpenter Metrics
Karpenter also makes several metrics available in Prometheus format to allow monitoring cluster provisioning status. These metrics are available by default at karpenter.kube-system.svc.cluster.local:8080/metrics configurable via the METRICS_PORT environment variable. Karpenter generates metrics under various categories. These include;
- Nodeclaims Metrics
- Nodes Metrics
- Pods Metrics
- Termination Metrics
- Scheduler Metrics
- Nodepools Metrics
- EC2NodeClass Metrics
- Interruption Metrics
- Cluster Metrics
- Cloudprovider Metrics
- Controller Runtime Metrics
- Workqueue Metrics
As aforementioned, Karpenter metrics are available in Prometheus format. These metrics can be scraped using one of the following options.
- Prometheus [most preferred]
- Self-Managed
- Amazon Managed Prometheus
- Grafana Agent, Telegraf, Fluent Bit/Fluentd
- OpenTelemetry
- Datadog, NewRelic, Splunk and other managed commercial offerings.
Karpenter Metrics Visualisation
Managed commercial platforms such as Datadog and New Relic provide out-of-the-box community dashboards for monitoring Karpenter, along with support for flexible dashboards and highly customisable alerts.
For customers who do not use these commercial offerings, the scraped Karpenter metrics can be forwarded to Grafana. Open-source Grafana provides an equivalent visualisation and alerting solution like a commercial managed offering. Below are the few out of the box free dashboards available in Grafana for Karpenter monitoring. These can be added to your Grafana dashboards by downloading them directly from Grafana.
Dashboard Example 1: Kubernetes/Autoscaling/Karpenter/Activity – Providing insights about Auto Scaling and reason for Node Termination.

Dashboard Example 2: Kubernetes/Autoscaling/Karpenter/Overview – Provides insights about instance CPU & Memory usage & instance capacity type.

Conclusion
In EKS Auto Mode, the Karpenter controller is fully managed by AWS, which limits the level of observability customers can build around it. In contrast, with a self-managed Karpenter deployment, it is essential to capture logs and metrics and to establish monitoring in order to continuously fine-tune its behaviour.
“Trust, but verify.” While Karpenter is a powerful and generally stable solution, it should not be treated as a black box. Everything fails, all the time. A robust observability and monitoring setup enables forensic analysis during production incidents and helps teams learn and improve over time to prevent recurring issues. The last thing any team wants is a production outage caused by Karpenter consolidating or terminating nodes during business hours.
If you have an EKS cluster and are looking to improve Kubernetes performance while optimising costs, reach out to Cevo.

Gokul is a passionate technologist with approximately 14 years of IT experience. He has held diverse roles, including DevOps Engineer, Technical Architect, Solution Architect, and Team/Project Manager. With a strong background in both on-premises and cloud environments (Azure/AWS), he has successfully led and delivered robust, cost-effective end-to-end solutions.